Lennard-Jones 150

SystemLennard-Jones
Atoms150
Runs100
Cap10000000 force calls

The main metric is Mean basin-hopping steps. Scoring rules.

Charts
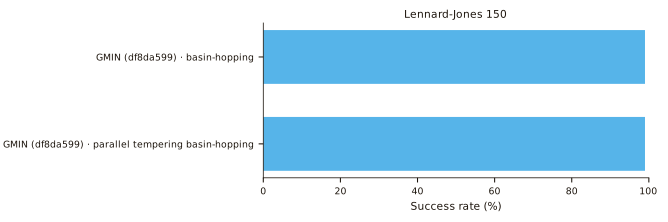
Success rate on Lennard-Jones 150, in rank order. The rate is the share of runs that finished. 2 ranked rows did not record a success rate and are not drawn.
Success rate on Lennard-Jones 150, in rank order. The rate is the share of runs that finished. 2 ranked rows did not record a success rate and are not drawn. PDF.
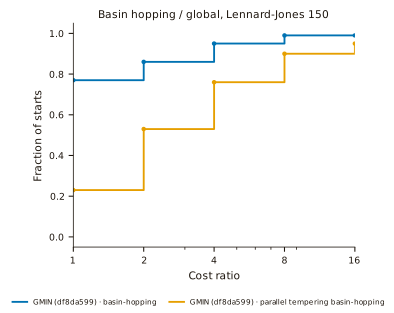
Dolan-Moré profile for Basin hopping / global on Lennard-Jones 150. The curve is the fraction of starts whose cost is at most tau times the best finite cost in this family. Tau is 1, 2, 4, 8, and 16. An unsolved start stays in the denominator and does not cross a finite tau. Dolan, E. D. and Moré, J. J., Math. Program. 91:201-213, 2002.
Dolan-Moré profile for Basin hopping / global on Lennard-Jones 150. The curve is the fraction of starts whose cost is at most tau times the best finite cost in this family. Tau is 1, 2, 4, 8, and 16. An unsolved start stays in the denominator and does not cross a finite tau. Dolan, E. D. and Moré, J. J., Math. Program. 91:201-213, 2002. PDF.
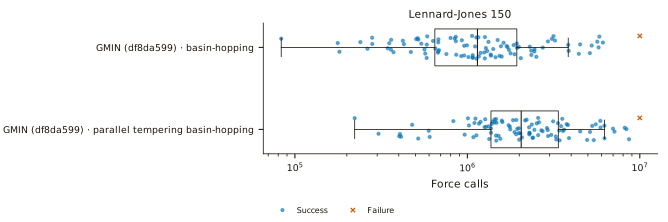
Force calls on each recorded start for Lennard-Jones 150. The box is the quartiles of those counts. A blue point is a success and a vermillion cross is a recorded failure (2). The horizontal position is the recorded count. The vertical offset only keeps marks from covering one another.
Force calls on each recorded start for Lennard-Jones 150. The box is the quartiles of those counts. A blue point is a success and a vermillion cross is a recorded failure (2). The horizontal position is the recorded count. The vertical offset only keeps marks from covering one another. PDF.
Performance profile for Lennard-Jones 15000.51124816Cost ratioFraction of startsGMIN (df8da599) · basin-hoppingGMIN (df8da599) · parallel tempering basin-hopping
Performance profile. Higher means more starts solved within that cost ratio.
  • GMIN (df8da599) · basin-hopping
  • GMIN (df8da599) · parallel tempering basin-hopping
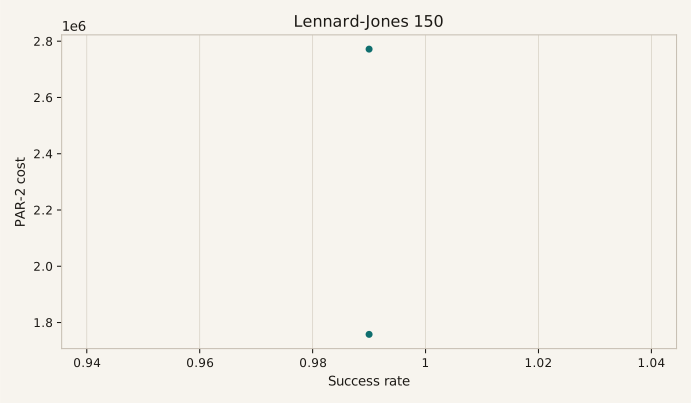
Cost distribution for Lennard-Jones 150011.75804e+06 to 2.26491e+06: 12.26491e+06 to 2.77178e+06: 11.75804e+062.77178e+06
Cost distribution of 2 ranked rows. Linear bins, from 1.75804e+06 to 2.77178e+06.

Performance profile SVG Cost and success SVG
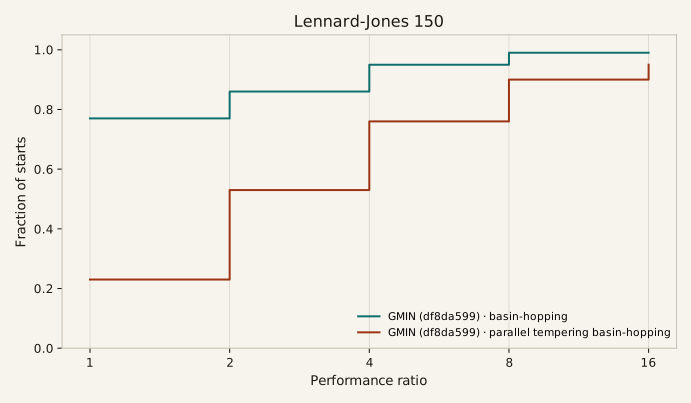
Performance profile for Lennard-Jones 150
Performance profile. Select the plot for the full SVG.
Cost and success for Lennard-Jones 150
Cost and success. Select the plot for the full SVG.
Best cost for lj150lj15010⁶10⁷cost (force calls, log scale)GMIN: 1.75804e+06GMIN1.75804e+06
A shorter bar is a lower cost on a log scale shared by the codes of this problem.

Leaderboard

A shorter bar is a lower cost on the log scale for that problem. Select a column heading to sort.
RankCodeBestMedianSuccessPAR-2
1 GMIN 1.75804e+06 2.26491e+06 99.0% 1.75804e+06

The tables below list every ranked row, by method family and overall.

Basin hopping / global

Basin hopping / global. One row is one code, one version, and one method. A lower cost is better. PAR-2 counts a finished run as the calls it used and a failed run as twice the cap. An archived row shows the average it published, and its PAR-2 applies that rule to the failures the entry records. Hessians is the mean analytic Hessian count. FD calls is that count times one force call per coordinate.
RankRowCostUnitHessiansFD callsRuns
1GMIN (df8da599) · basin-hopping1.75804e+06force calls00100
2GMIN (df8da599) · parallel tempering basin-hopping2.77178e+06force calls00100

Overall

One row is one code, one version, and one method. A lower cost is better. PAR-2 counts a finished run as the calls it used and a failed run as twice the cap. An archived row shows the average it published, and its PAR-2 applies that rule to the failures the entry records. Hessians is the mean analytic Hessian count. FD calls is that count times one force call per coordinate.
RowFamilyFamily rankUnitPAR-2PublishedMedian callsMean callsHessiansFD callsFailuresRuns
GMIN (df8da599) · basin-hoppingBasin hopping / global1force calls1.75804e+061.14412e+061.65804e+0600crash 0, divergence 0, cap 1, wrong_stationary 0100
GMIN (df8da599) · parallel tempering basin-hoppingBasin hopping / global2force calls2.77178e+062.05174e+062.67178e+0600crash 0, divergence 0, cap 1, wrong_stationary 0100

A row that counts another unit is ranked in its own table after the overall table.

Ranked in quenches

These rows count quenches. The tables above count force calls, so these rows are ranked only among themselves.

The archived basin_hopping_steps_mean is the benchmark website's mean Q. That page benchmarks these entries on the number of quenches [Q] and the number of energy steps [V]. The harness rows count force calls, and no source equates an energy step with a force call.

One row is one code, one version, and one method. A lower cost is better. PAR-2 counts a finished run as the calls it used and a failed run as twice the cap. An archived row shows the average it published, and its PAR-2 applies that rule to the failures the entry records. Hessians is the mean analytic Hessian count. FD calls is that count times one force call per coordinate.
RowFamilyFamily rankUnitPAR-2PublishedMedian callsMean callsHessiansFD callsFailuresRuns
GMIN · core orbits symmetrisation schemeBasin hopping / global1quenches667.38000 failed100
GMIN · no symmetrisationBasin hopping / global2quenches3280.89000 failed100